
Trace Processor (C++)
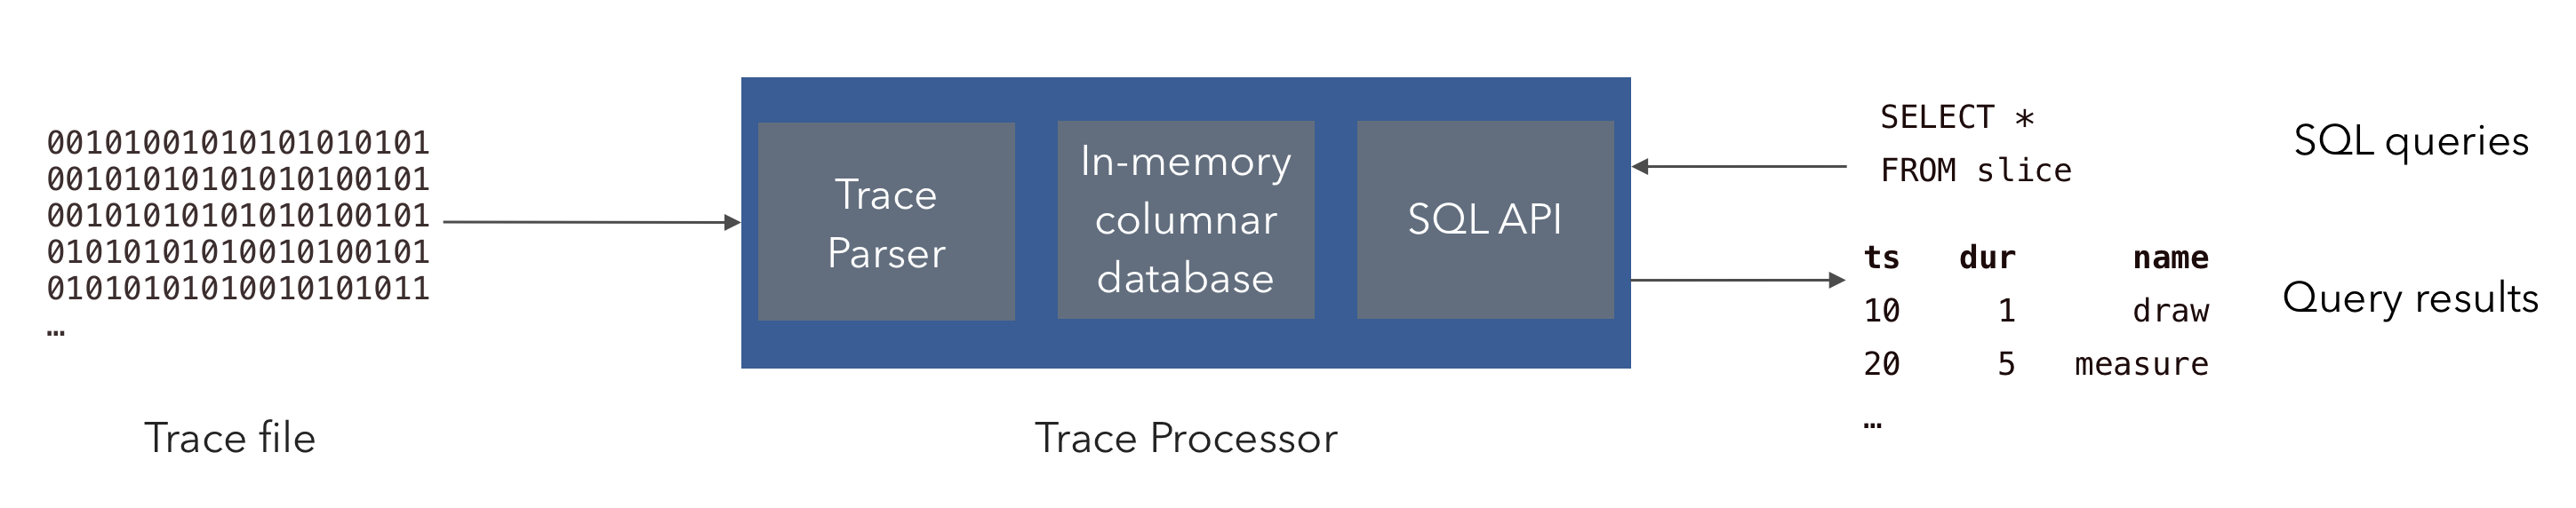
Trace Processor 是一个 C++ 库(/src/trace_processor),它摄取以多种格式编码的 trace,并公开 SQL 接口来查询存储在一组一致表中的 trace 事件。它还具有其他功能,包括计算 trace 汇总、使用用户友好的描述为 trace 添加注释以及从 trace 的内容派生新事件。
大多数用户将通过 trace_processor shell 与 Trace Processor 交互,这是一个围绕该库的命令行包装器,可打开交互式 PerfettoSQL 提示符。想要将 Trace Processor 集成到其他 C++ 应用程序中的嵌入者应跳转到嵌入 C++ 库。Python 用户应参阅 Python API。
trace_processor shell
trace_processor shell 是一个命令行二进制文件,它包装 C++ 库,提供一种方便的方法来交互式分析 trace。
下载 shell
可以从 Perfetto 网站下载 shell。下载的是一个轻量级 Python 包装器,首次使用时会在 ~/.local/share/perfetto/prebuilts 下获取并缓存适合你平台的原生二进制文件(包括 Windows 上的 trace_processor_shell.exe)。
curl -LO https://get.perfetto.dev/trace_processor
chmod +x ./trace_processor
curl.exe -LO https://get.perfetto.dev/trace_processor
运行包装脚本需要 Python 3。curl 随 Windows 10 及更高版本附带。
运行 shell
下载后,你可以立即使用它打开 trace 文件:
./trace_processor trace.perfetto-trace
python trace_processor trace.perfetto-trace
这将打开一个交互式 SQL shell,你可以在其中查询 trace。有关如何编写查询的更多信息,请参阅 PerfettoSQL 入门指南。
例如,要查看 trace 中的所有 Slice,你可以运行以下查询:
> SELECT ts, dur, name FROM slice LIMIT 10;
ts                   dur                  name
-------------------- -------------------- ---------------------------
     261187017446933               358594 eglSwapBuffersWithDamageKHR
     261187017518340                  357 onMessageReceived
     261187020825163                 9948 queueBuffer
     261187021345235                  642 bufferLoad
     261187121345235                  153 query
...
或者,要查看所有 Counter 的值:
> SELECT ts, value FROM counter LIMIT 10;
ts                   value
-------------------- --------------------
     261187012149954          1454.000000
     261187012399172          4232.000000
     261187012447402         14304.000000
     261187012535839         15490.000000
     261187012590890         17490.000000
     261187012590890         16590.000000
...
子命令接口
除了启动交互式 REPL,trace_processor 还提供了一个基于子命令的 CLI,用于非交互式工作流:运行 SQL 查询、计算 trace 汇总、导出为 SQLite、启动 RPC 服务器以及在 trace 格式之间转换。通用调用方式为:
trace_processor <command> [flags] [positional args]运行 trace_processor --help 查看顶级摘要,或运行 trace_processor help <command>(等价于 trace_processor <command> --help)查看特定子命令接受的标志。顶级帮助如下:
Perfetto Trace Processor.
Usage: trace_processor [command] [flags] [trace_file]

If no command is given, opens an interactive SQL shell on the trace file.

Commands:
  query         Load a trace and run a SQL query.
  interactive   Interactive SQL shell (default if no command is given).
  server        Start an RPC server (http or stdio).
  summarize     Compute a trace summary from specs and/or built-in metrics.
  export        Export a trace to a database file.
  metrics       Run v1 metrics (deprecated; use 'summarize --metrics-v2').
  convert       Convert trace format.

Common flags (apply to all commands):
  -h, --help                  Show help (per-command if after a command).
  -v, --version               Print version.
      --full-sort             Force full sort ignoring windowing.
      --no-ftrace-raw         Prevent ingestion of typed ftrace into raw table.
      --add-sql-package PATH  Register SQL files from a directory as a package.
  -m, --metatrace FILE        Enable metatracing, write to FILE.
向后兼容。 之前的扁平标志接口(例如
-q、-Q、--httpd、--summary、--run-metrics、-e、--stdiod)通过内部转换层完全支持;现有脚本和集成无需更改即可继续工作。运行trace_processor --help-classic查看完整的经典标志参考。
query — 运行 SQL
加载 trace,运行一个或多个以 ; 分隔的 SQL 语句,将结果打印到标准输出,然后退出。SQL 可以作为内联位置参数提供、通过 -f/--query-file 从文件读取,或通过 stdin 管道传入(通过将 - 传递给 --query-file 或在未指定 SQL 时通过管道传入):
# 1. 内联查询。
trace_processor query trace.pftrace "SELECT ts, dur, name FROM slice LIMIT 5"

# 2. 从文件。
trace_processor query -f queries.sql trace.pftrace

# 3. 从 stdin。
cat queries.sql | trace_processor query trace.pftrace
常用标志:
-f, --query-file FILE— 从FILE读取 SQL(或-表示 stdin)。-i, --interactive— 查询完成后进入交互式 REPL。-W, --wide— 打印结果时使用双倍宽度列。--perf-file FILE— 将 trace 加载和查询计时写入FILE。--structured-query-id ID+--summary-spec FILE(高级) — 从一个或多个 TraceSummarySpec 文件中按 ID 执行单个结构化查询。规范替代内联/文件/stdin SQL 源。
interactive — REPL
打开上一节中展示的交互式 PerfettoSQL 提示符。这是未指定子命令时的默认子命令,因此 trace_processor trace.pftrace 和 trace_processor interactive trace.pftrace 是等价的。唯一的特定子命令标志是 -W, --wide。
server — HTTP / stdio RPC
通过远程过程调用协议暴露 Trace Processor。
# HTTP 服务器(ui.perfetto.dev 使用)。默认监听 9001。
trace_processor server http

# 预加载 trace 并通过 HTTP 服务。
trace_processor server http trace.pftrace

# stdio 服务器(长度前缀 RPC;用于将 trace_processor 作为子进程嵌入的工具)。
trace_processor server stdio
服务器特定标志:
--port PORT— HTTP 端口(默认 9001)。--ip-address IP— HTTP 绑定地址。--additional-cors-origins O1,O2,...— 在默认值(https://ui.perfetto.dev、http://localhost:10000、http://127.0.0.1:10000)之外的额外 CORS 允许来源。
在 http 模式下,trace 文件是可选的:客户端也可以远程加载 trace。最常见的客户端是 Perfetto UI,它会自动检测本地服务器并将 trace 解析卸载给它;参见可视化大型 trace 了解用户端流程,或 trace_processor.proto 了解 RPC 线路架构。
summarize — trace 汇总和 v2 Metric
计算 trace 汇总。规范文件作为 trace 文件之后的额外位置参数传递;内置 v2 Metric 通过 --metrics-v2 选择:
# 运行所有可用的 v2 Metric。
trace_processor summarize --metrics-v2 all trace.pftrace

# 运行 spec.textproto 中定义的两个特定 metric ID。
trace_processor summarize \
  --metrics-v2 startup_metric,memory_metric \
  trace.pftrace spec.textproto
子命令标志:
--metrics-v2 IDS— 逗号分隔的 metric ID,或字面值all。--metadata-query ID— 用于填充汇总metadata字段的查询 ID。--format text|binary—TraceSummaryproto 的输出格式(默认:text)。--post-query FILE— 汇总完成后运行的 SQL 文件。设置后,不打印汇总 proto;而是打印 SQL 输出。--perf-file FILE— 将加载/查询计时写入FILE。-i, --interactive— 汇总完成后进入 REPL。
规范文件根据扩展名自动检测为二进制或文本(.pb → 二进制,.textproto → 文本),并附带内容嗅探回退。
全局标志(适用于每个子命令)
除了上面的特定子命令标志外,还接受以下全局标志,在各子命令中行为一致:
- Trace 摄取:
--full-sort、--no-ftrace-raw、--analyze-trace-proto-content、--crop-track-events。 - PerfettoSQL 包:
--add-sql-package PATH[@PKG]、--override-sql-package PATH[@PKG]、--override-stdlib PATH(需要--dev)。 - Metric 扩展:
--metric-extension DISK_PATH@VIRTUAL_PATH。 - 辅助文件内容:
--register-files-dir PATH— 将PATH下的文件内容暴露给导入器(例如 ETM 解码器)。 - 开发:
--dev、--dev-flag KEY=VALUE、--extra-checks。 - 元追踪:
-m, --metatrace FILE、--metatrace-buffer-capacity N、--metatrace-categories CATEGORIES— 生成 Trace Processor 自身的 Perfetto trace,可以重新加载到 UI 中进行性能调试。
嵌入 C++ 库
公共 API 以 trace_processor.h 中定义的 TraceProcessor 类为中心。所有高级操作 — 解析 trace 字节、执行 SQL 查询、计算汇总 — 都是此类的成员函数。
通过 CreateInstance 创建 TraceProcessor 实例:
using namespace perfetto::trace_processor;
Config config;
std::unique_ptr<TraceProcessor> tp = TraceProcessor::CreateInstance(config);加载 trace
要摄取 trace,请使用 trace 字节块重复调用 Parse,然后在推送完整个 trace 后调用 NotifyEndOfFile:
while (/* more data available */) {
  TraceBlobView blob = /* ... */;
  base::Status status = tp->Parse(std::move(blob));
  if (!status.ok()) { /* handle error */ }
}
base::Status status = tp->NotifyEndOfFile();
由于从文件系统读取 trace 是一个常见场景,因此在 read_trace.h 中提供了辅助函数 ReadTrace:
base::Status status = ReadTrace(tp.get(), "/path/to/trace.pftrace");ReadTrace 从磁盘读取文件,使用内容调用 Parse,并为你调用 NotifyEndOfFile。
执行查询
通过 ExecuteQuery 提交查询,它返回一个 Iterator,以流式方式将行返回给调用者:
auto it = tp->ExecuteQuery("SELECT ts, name FROM slice LIMIT 10");
while (it.Next()) {
  int64_t ts = it.Get(0).AsLong();
  std::string name = it.Get(1).AsString();
  // ...
}
if (!it.Status().ok()) {
  // Query produced an error.
}
使用迭代器时的两条重要规则:
- 始终在访问值之前调用
Next。迭代器在返回时定位在第一行之前,因此在Next返回true之前不能调用Get。 - 始终在迭代结束后检查
Status。查询可能在执行过程中失败;Next返回false仅意味着迭代停止,并不意味着成功。检查Status()以区分 EOF 和错误。
有关完整的迭代器 API,请参阅 iterator.h 中的注释。
其他功能
TraceProcessor 类还提供:
- Trace 汇总(
Summarize)— 计算 trace 的结构化汇总。有关此功能的面向用户描述,请参阅 Trace 汇总。 - 自定义 SQL 包(
RegisterSqlPackage)— 在包名下注册 PerfettoSQL 文件,以便查询可以INCLUDE它们。 - 带外文件内容(
RegisterFileContent)— 将辅助数据传递给导入器,例如用于解码 ETM trace 的二进制文件。 - 元追踪(
EnableMetatrace/DisableAndReadMetatrace)— 对 Trace Processor 本身进行追踪以进行性能调试。
有关完整的 API 接口,请参阅 trace_processor.h 中的注释。